Charts · SlideShortcuts
Consulting charts, drawn as real PowerPoint shapes.
On Windows, the SlideShortcuts tab draws 16 kinds of chart, from stacked bars to waterfall, Mekko and Gantt. Double-click one to edit its data, and one Ctrl+Z takes it off. Decks with these charts open and print anywhere, a Mac included, without SlideShortcuts.
7 days free, then $9.99 a month plus any tax. Card required. We email you 3 days before the trial ends. Cancel before day 7 and pay nothing.
On a Mac, the same 16 chart types are on the SlideShortcuts panel's Charts tab. The panel is a free add-in from Microsoft AppSource.
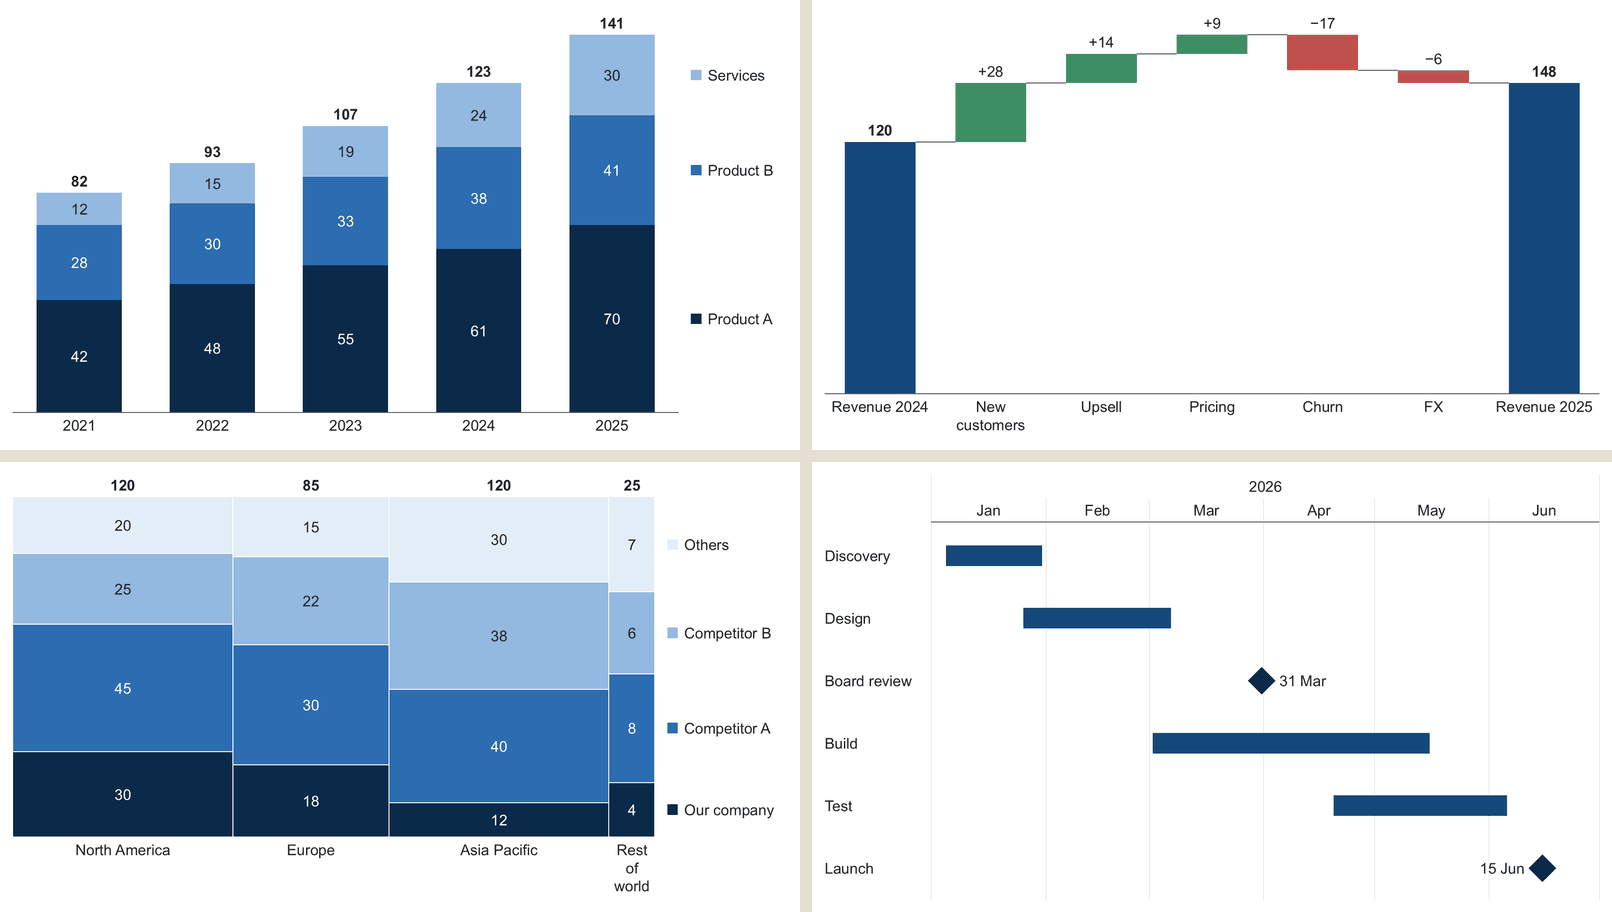
16 kinds
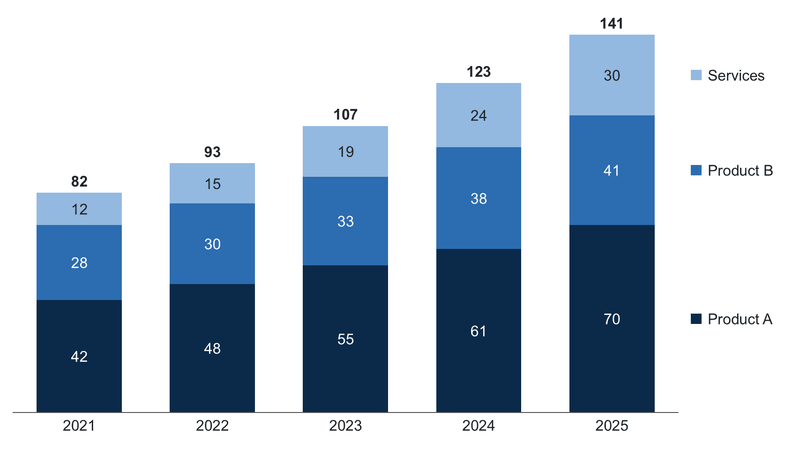 Stacked
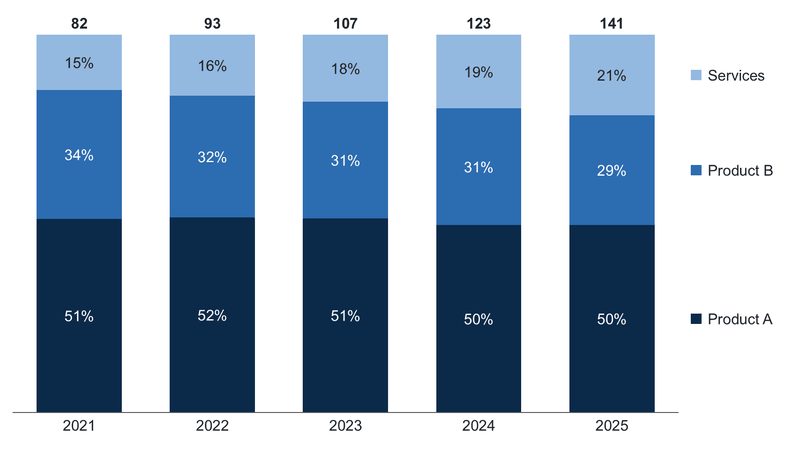 100%
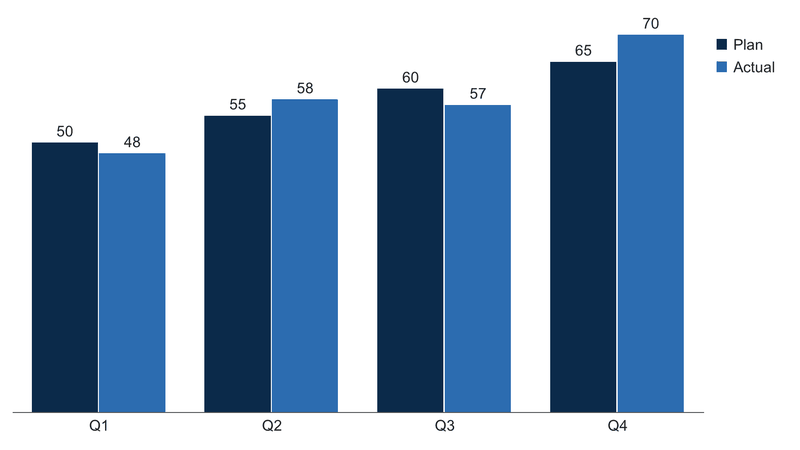 Clustered
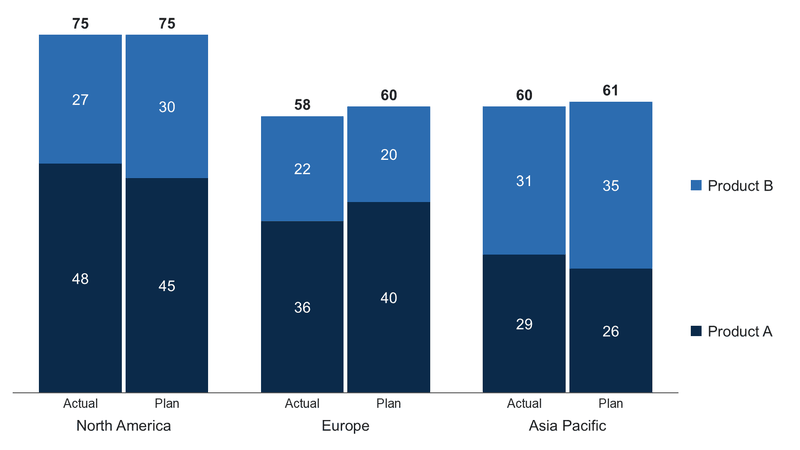 Clustered stacked
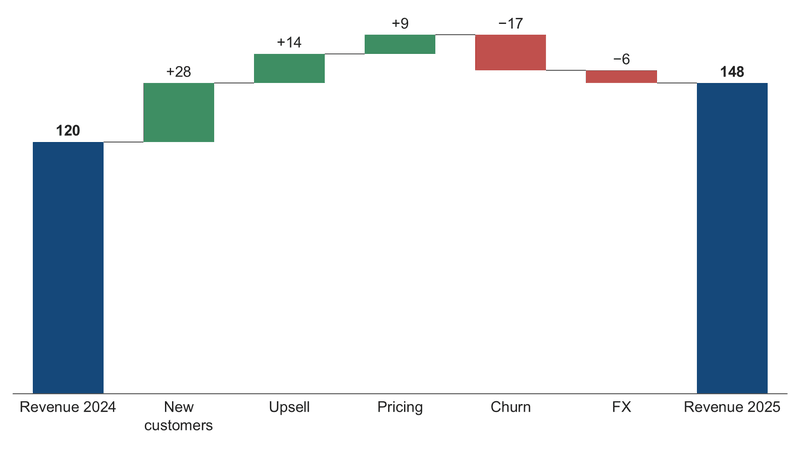 Waterfall
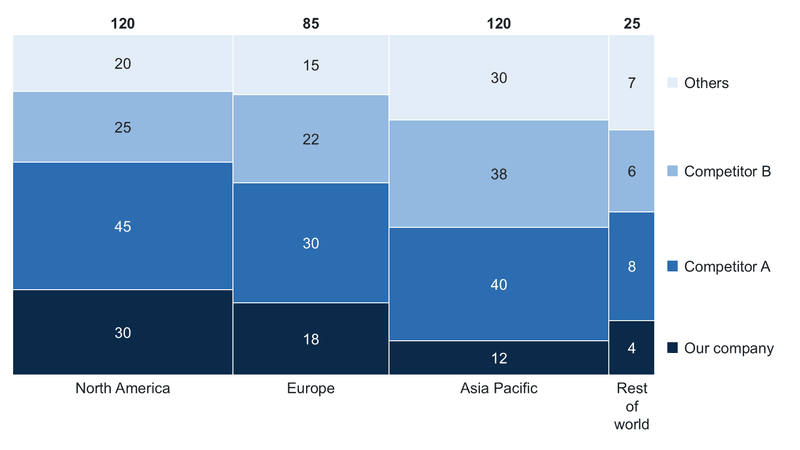 Mekko
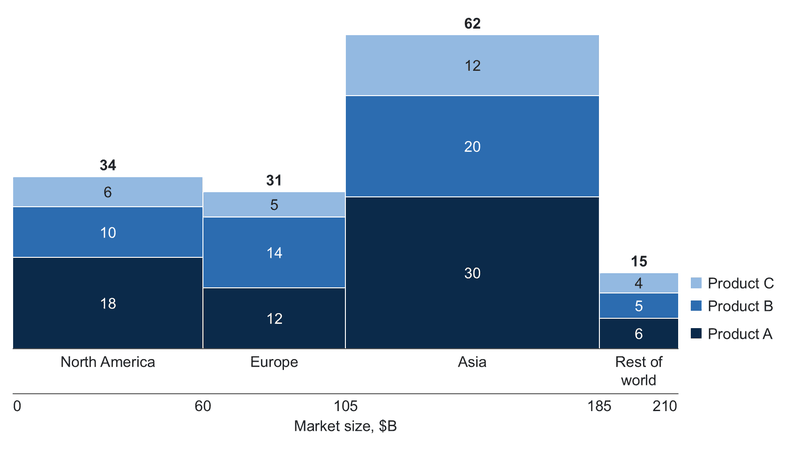 Mekko in units
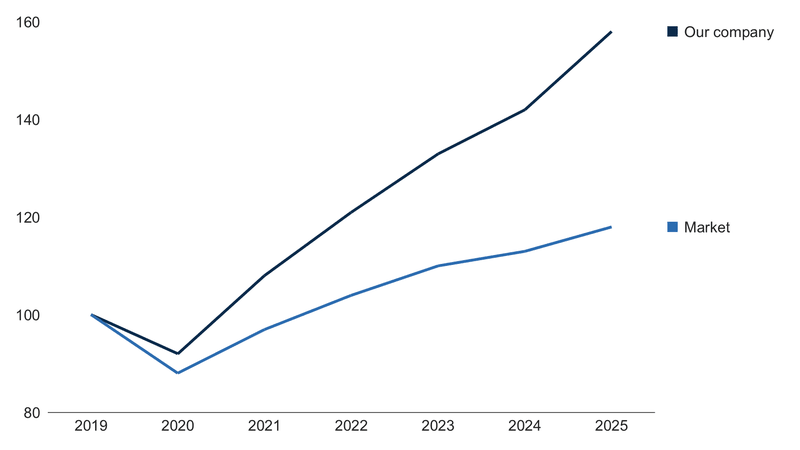 Line
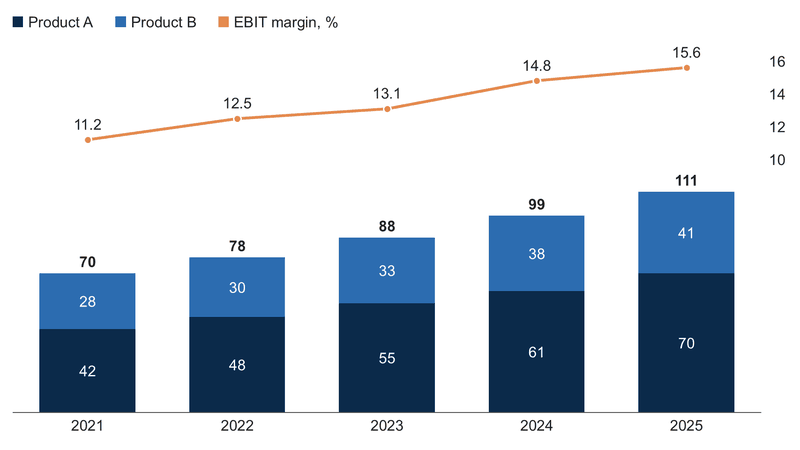 Combination
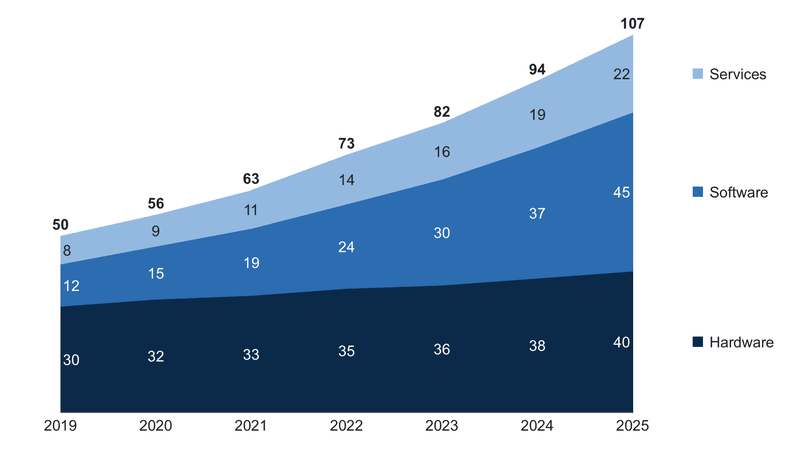 Area
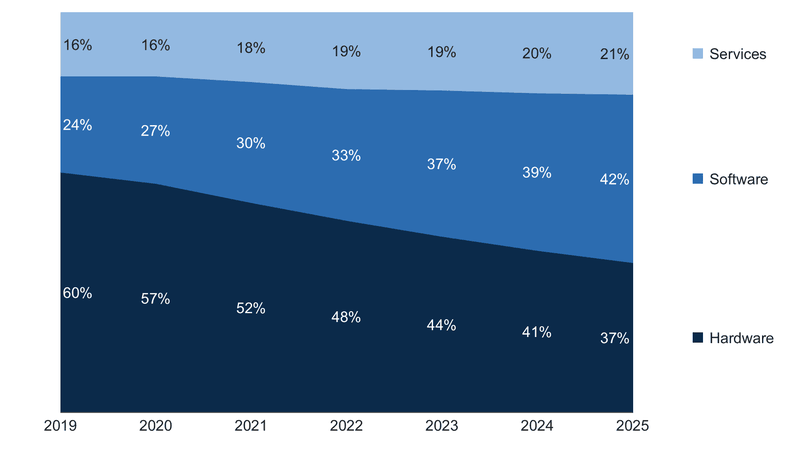 100% area
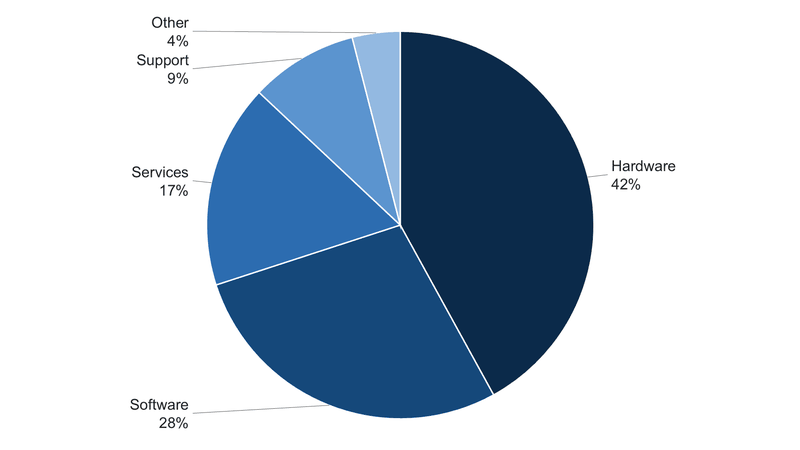 Pie
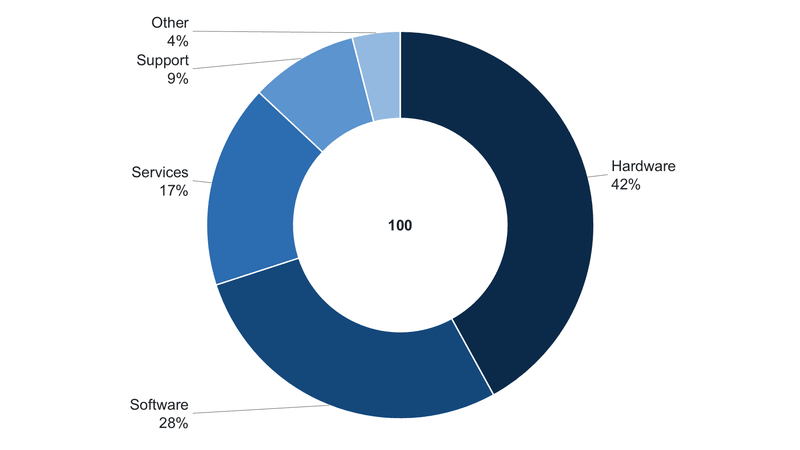 Doughnut
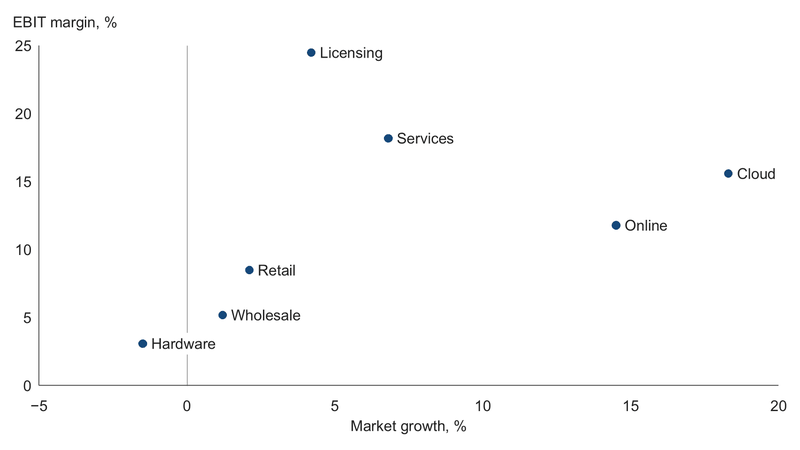 Scatter
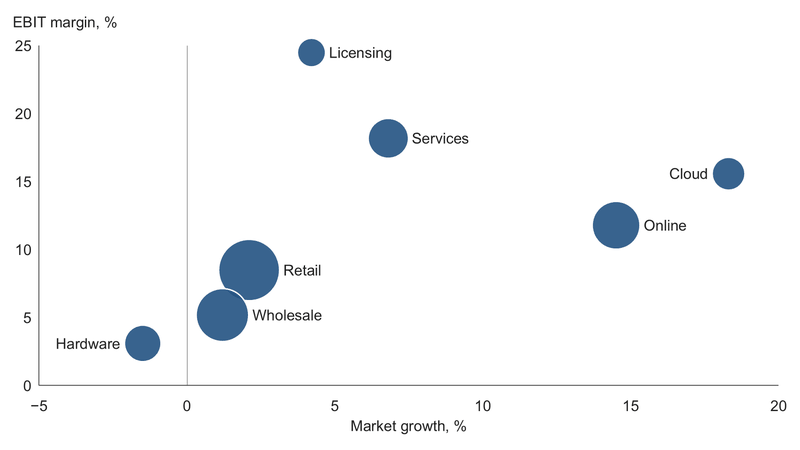 Bubble
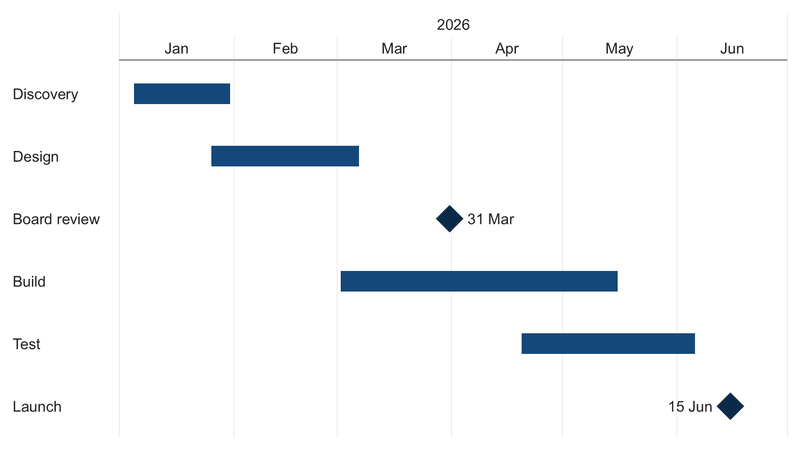 Gantt
How it works on Windows
- On the SlideShortcuts tab, choose Insert > Charts and pick a kind. The chart lands on the slide, in an empty placeholder if there is one.
- Type or paste your numbers in its data sheet. The chart follows.
- Double-click the chart any time to edit its data again. One Ctrl+Z takes a new chart off.
- The Chart tab. Select a chart for legend, values, totals, CAGR and difference arrows, an average line, an axis break, units and currency, decimals and the color set.
- Real shapes. Each chart is ordinary PowerPoint shapes, so it opens and prints anywhere, without SlideShortcuts.
- Its own data sheet. Not linked to Excel: the numbers live with the chart in the deck.
Questions
What do I need?
SlideShortcuts for Windows 17.2.1 or later. Charts run in Microsoft Edge WebView2, which Windows 11 and Microsoft 365 include; on a PC without it, Charts say to ask your IT team and everything else works. The first chart in a PowerPoint session takes about two seconds to start.
Does it work on a Mac?
Yes. The same 16 chart types are in the SlideShortcuts panel: open the panel in PowerPoint for Mac, choose its Charts tab, and double-click a chart to edit its data. The panel is a free add-in from Microsoft AppSource, separate from the Mac app. A deck with charts from Windows opens and prints on any Mac like any other deck.
Is the data linked to Excel?
No. Each chart keeps its own data sheet in the deck. Paste numbers in from Excel, or type them.