Home › Templates › Cause and effect
Fishbone and cause and effect templates for PowerPoint
Root cause pages: fishbones with four or six categories, three factors behind one outcome, an influence diagram with plus and minus links, one cause with four effects, and causes, effects and responses side by side. Use them to show you've looked at every reason before proposing a fix. Each one arrives in your deck's own colors and fonts.
- Mac: all 18, in the Templates tab of the SlideShortcuts panel.
- Windows: all 18, under Insert > Templates on the SlideShortcuts tab.
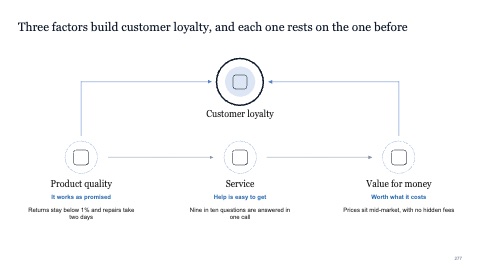
Three factors influencing one outcome
MacWindows
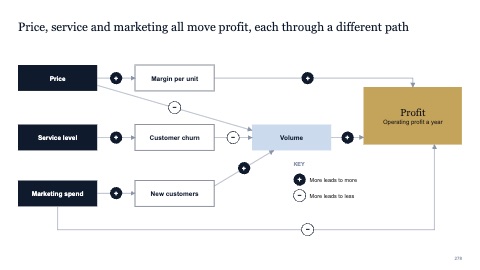
Influence diagram with plus and minus links
MacWindows
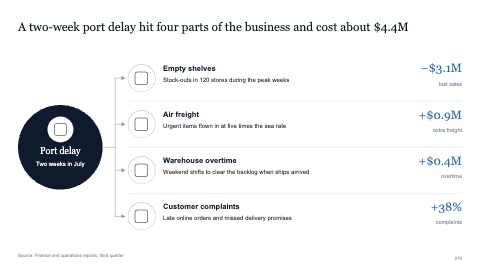
One cause with four effects
MacWindows
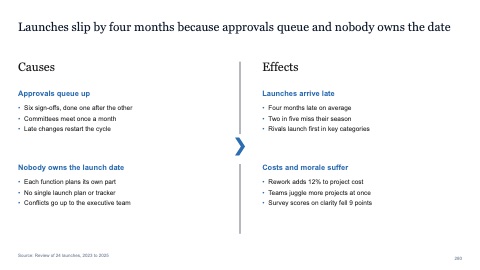
Causes and effects in two columns
MacWindows
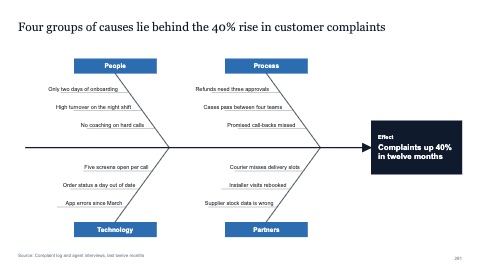
Fishbone with four categories
MacWindows
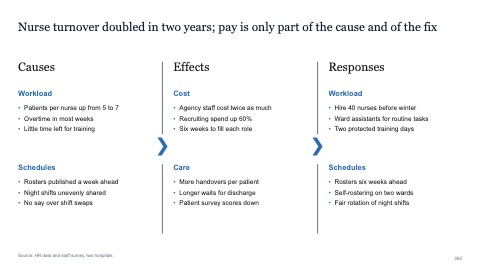
Causes, effects and responses
MacWindows
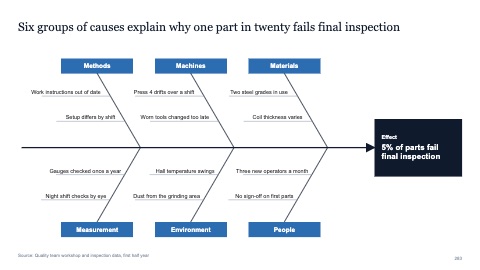
Fishbone with six categories
MacWindows
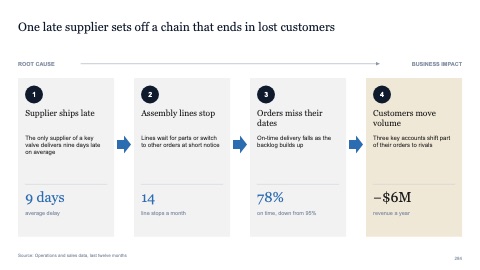
Cause-to-effect chain in four steps
MacWindows
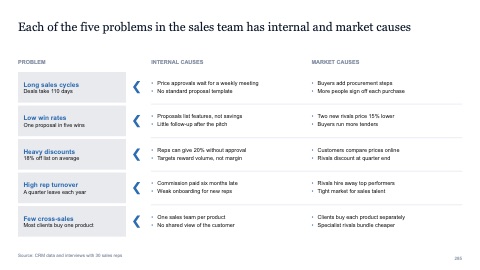
Five problems with internal and market causes
MacWindows
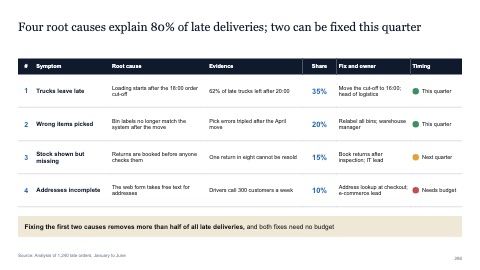
Root-cause table
MacWindows
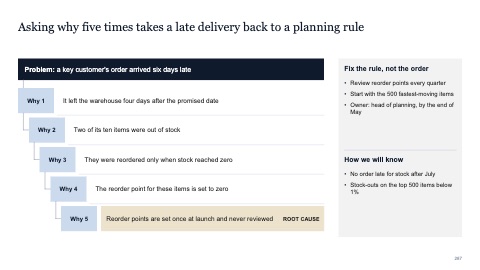
Five whys
MacWindows
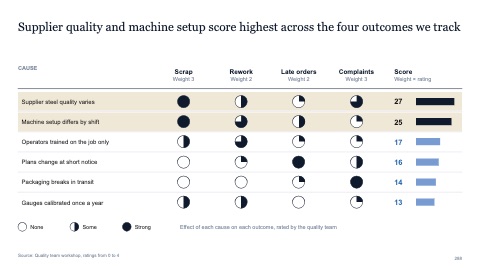
Cause and effect matrix
MacWindows
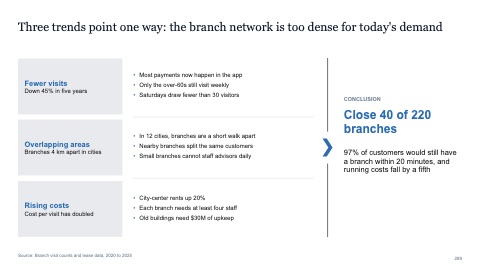
Three causes and one conclusion
MacWindows
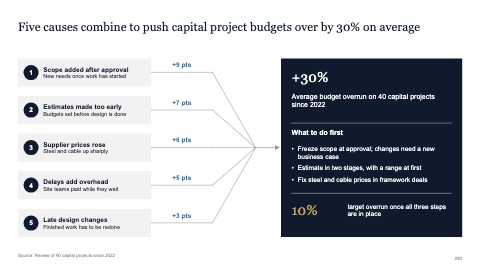
Five causes converging on one effect
MacWindows
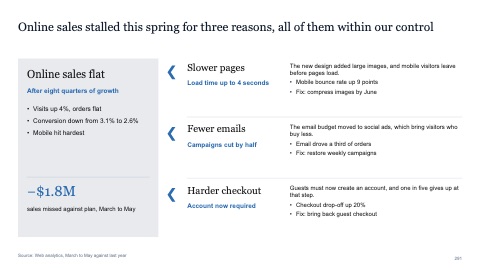
One effect explained by three causes
MacWindows
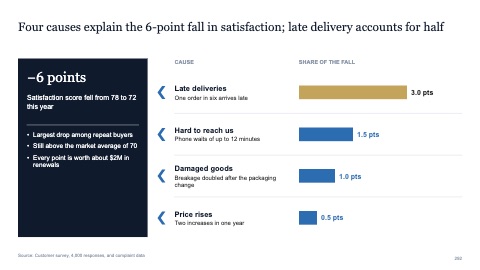
One effect with four weighted causes
MacWindows
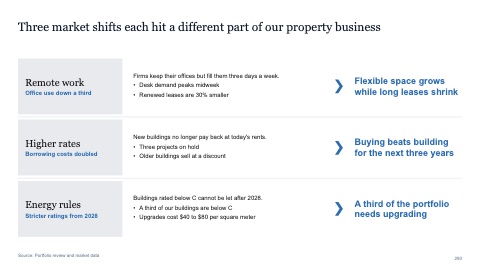
Causes with their effects in rows
MacWindows
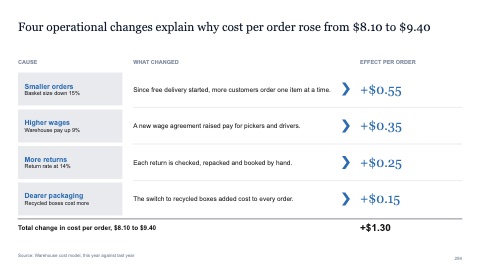
Four causes with measured effects
MacWindows
Numbers and names on the templates are samples. Replace them with your own.
Questions
What is a fishbone diagram?
A root cause diagram, also called an Ishikawa diagram. The problem sits at the head, and the possible causes branch off the spine, grouped into categories such as people, process, technology and data.
How do I make a fishbone diagram in PowerPoint?
Draw a horizontal spine to the problem, add angled lines for each category, and list the causes along each line. Inserting one of these gives you the bones already in place.
Try every page in your own deck
Every SlideShortcuts plan includes the templates, the keyboard shortcuts and the charts.
Start free trial7 days free, then $9.99 a month plus any tax. Card required. We email you 3 days before the trial ends. Cancel before day 7 and pay nothing.