Home › Templates › Process infographics
Process infographic templates for PowerPoint
Processes with more visual weight: stages with pointers to a timeline, stages with status, three phases with gates, and steps in zigzag circles or hexagons. Use them for a client-facing overview or a kickoff, where a plain chevron feels too thin. Each one arrives in your deck's own colors and fonts.
- Mac: all 25, in the Templates tab of the SlideShortcuts panel.
- Windows: all 25, under Insert > Templates on the SlideShortcuts tab.
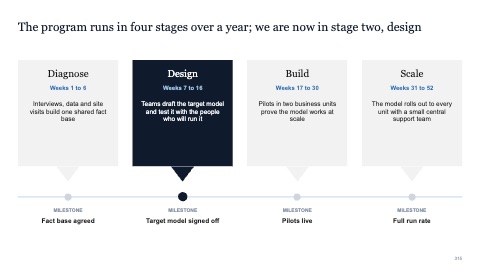
Four stages with pointers to a timeline
MacWindows
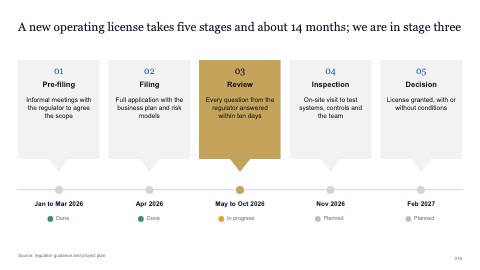
Five stages with status on a timeline
MacWindows
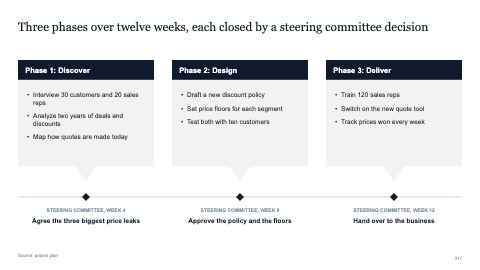
Three phases with gates on a timeline
MacWindows
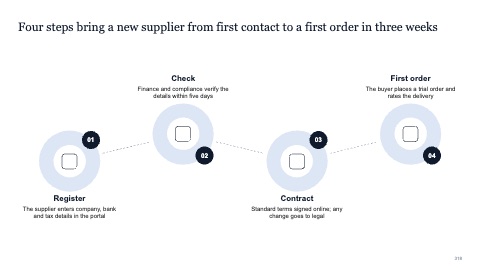
Four steps in zigzag circles
MacWindows
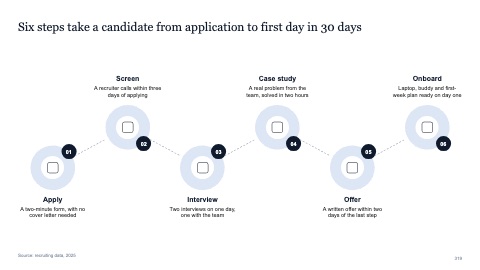
Six steps in zigzag circles
MacWindows
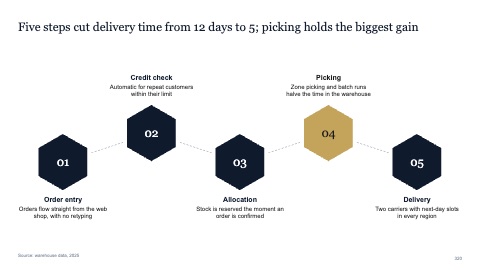
Five steps in zigzag hexagons
MacWindows
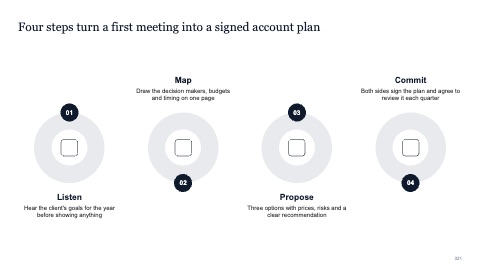
Four circles in a row, text above and below
MacWindows
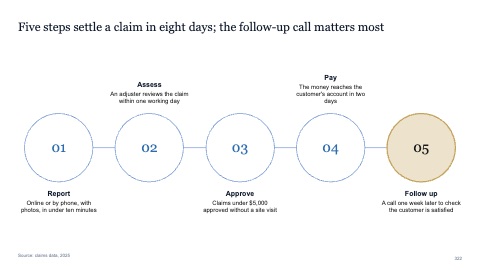
Five linked circles with the last one highlighted
MacWindows
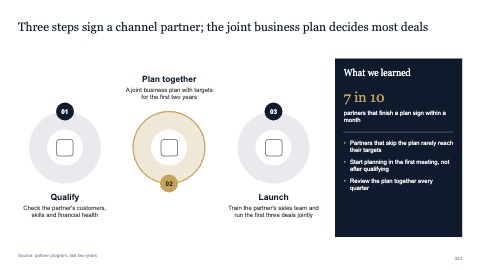
Three circles with a takeaway panel
MacWindows
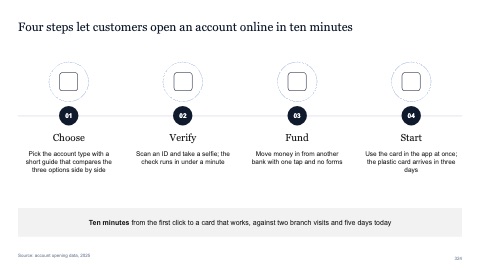
Four steps with icons over a line
MacWindows
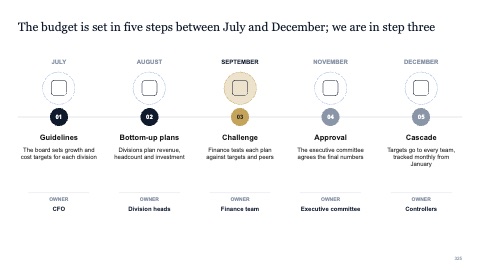
Five steps with months, icons and the current step
MacWindows
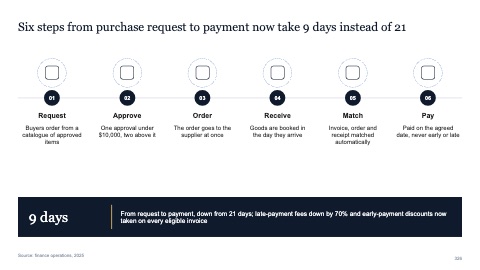
Six steps with icons and a result bar
MacWindows
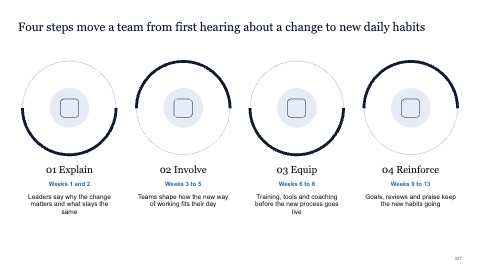
Four circles with alternating half rings
MacWindows
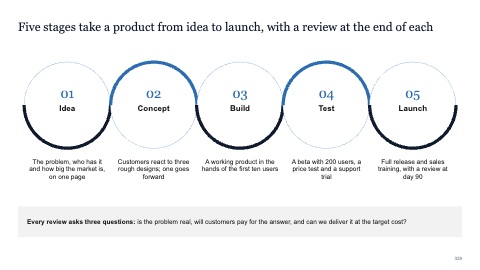
Five touching circles joined by a wave
MacWindows
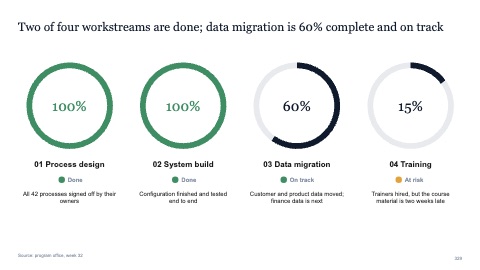
Four steps with progress rings
MacWindows
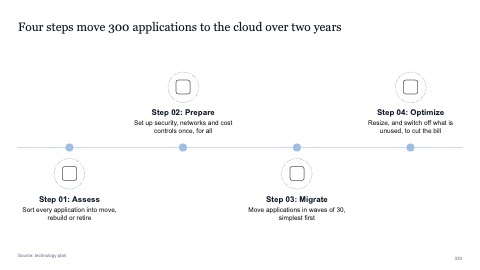
Four steps alternating along a line
MacWindows
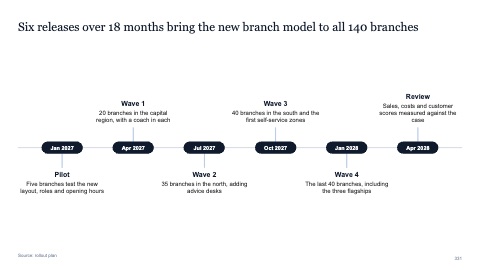
Six dated releases alternating along a line
MacWindows
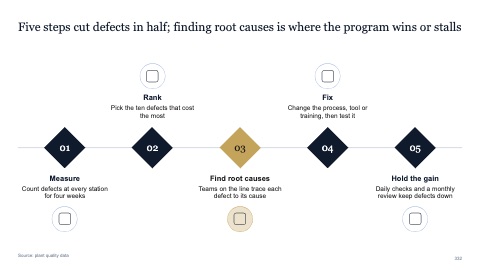
Five diamonds on a line with one highlighted
MacWindows
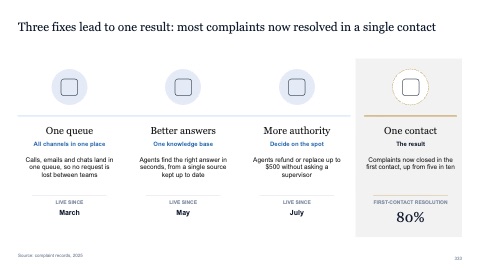
Four columns with the result highlighted
MacWindows
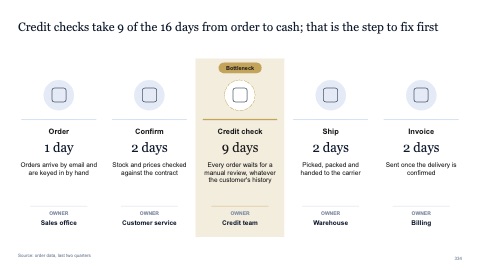
Five steps with the bottleneck highlighted
MacWindows
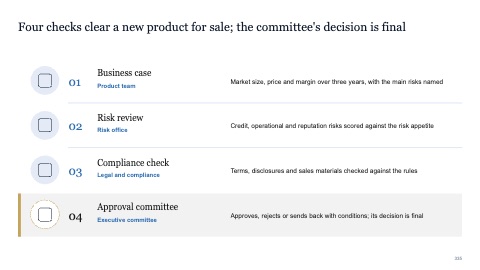
Four steps in rows with the last one highlighted
MacWindows
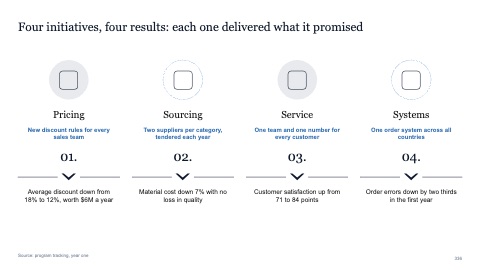
Four steps, each with its result
MacWindows
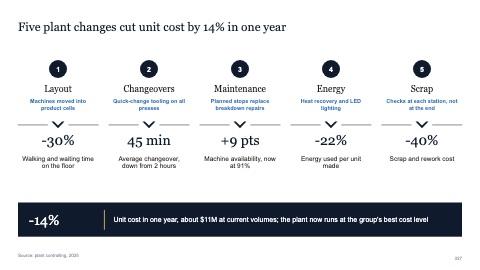
Five steps with a figure for each result
MacWindows
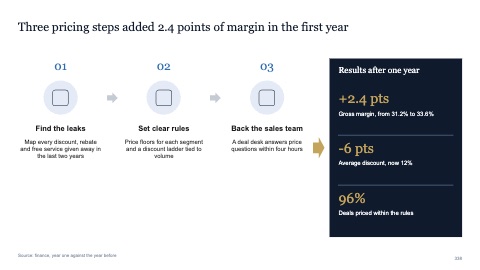
Three steps feeding a results column
MacWindows
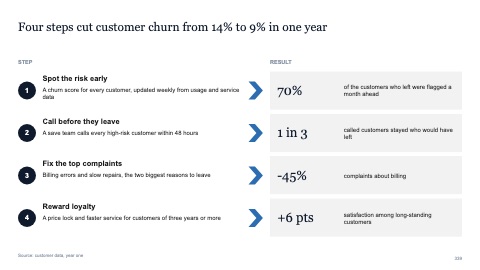
Four steps in rows, each pointing to its result
MacWindows
Numbers and names on the templates are samples. Replace them with your own.
Questions
What is a stage gate?
A checkpoint between phases where a group decides whether the work moves on, changes or stops, based on criteria agreed in advance.
Process infographic or process flow?
A flow shows the exact sequence and who does each step. An infographic gives the big picture of a few stages, for an audience that needs the shape rather than the detail.
Try every page in your own deck
Every SlideShortcuts plan includes the templates, the keyboard shortcuts and the charts.
Start free trial7 days free, then $9.99 a month plus any tax. Card required. We email you 3 days before the trial ends. Cancel before day 7 and pay nothing.