Table slide templates for PowerPoint
Tables that read like a consulting page, not a spreadsheet: feature comparisons, a RACI matrix, a financial table with a highlighted row, a benchmark with bars, a risk register and a KPI scorecard. Rows and columns are real PowerPoint tables, so they resize and sort the way you expect. Each one arrives in your deck's own colors and fonts.
- Mac: all 30, in the Templates tab of the SlideShortcuts panel.
- Windows: all 30, under Insert > Templates on the SlideShortcuts tab.
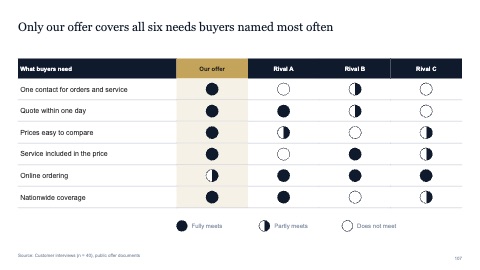
Feature comparison
MacWindows
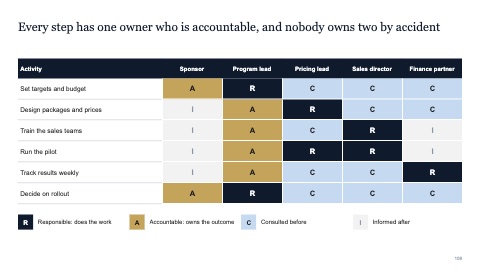
RACI matrix
MacWindows
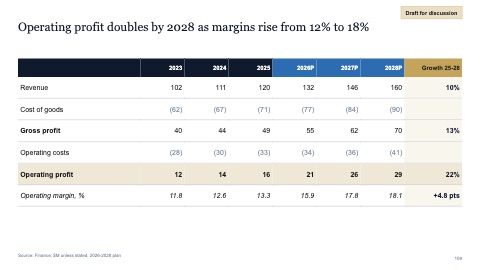
Financial table with a highlighted row
MacWindows
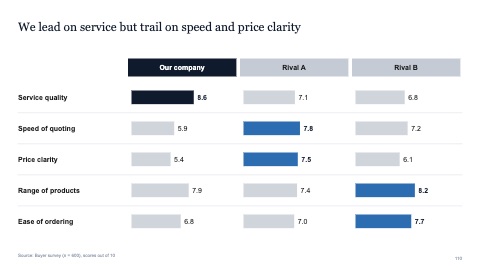
Benchmark table with bars
MacWindows
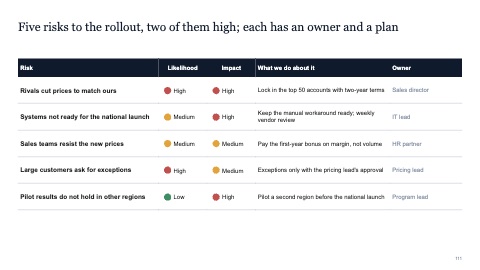
Risk register
MacWindows
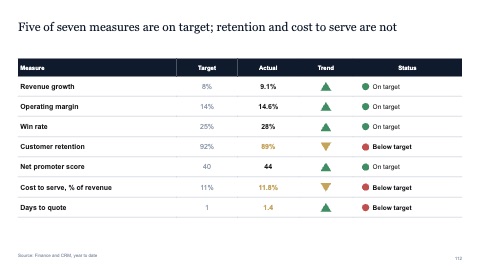
KPI scorecard
MacWindows
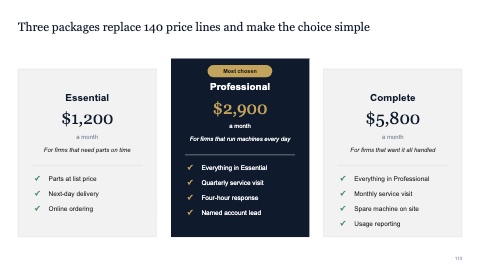
Three packages
MacWindows
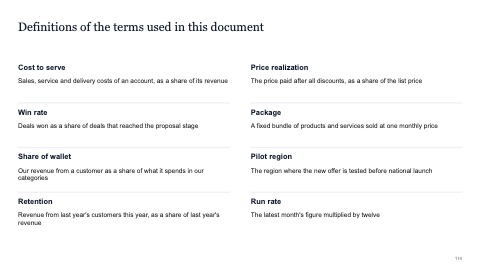
Definitions
MacWindows
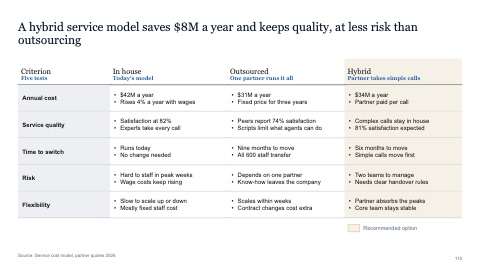
Table with four columns
MacWindows
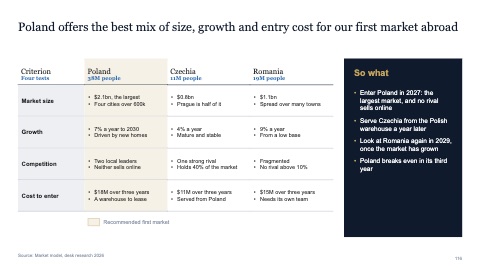
Four-column table with a so-what panel
MacWindows
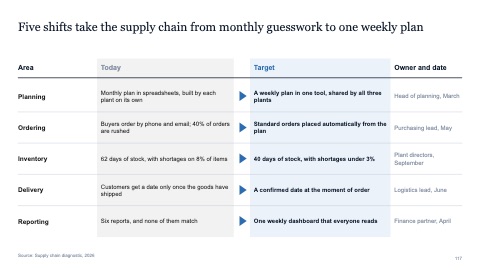
From-to table
MacWindows
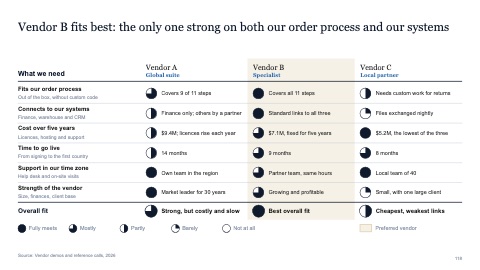
Criteria table with Harvey balls
MacWindows
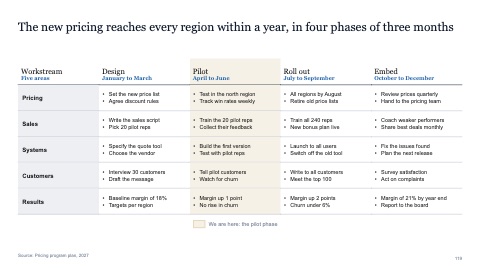
Table with five columns
MacWindows
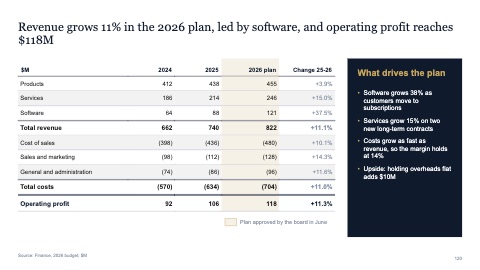
Financial summary with total rows
MacWindows
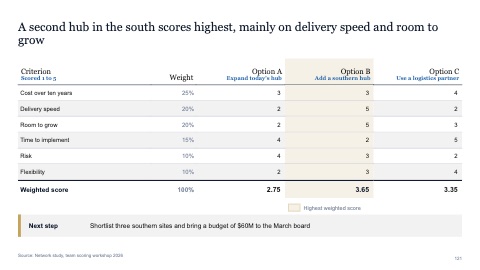
Option evaluation with weighted scores
MacWindows
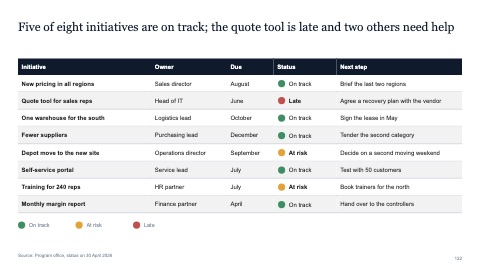
Tracker with status dots
MacWindows
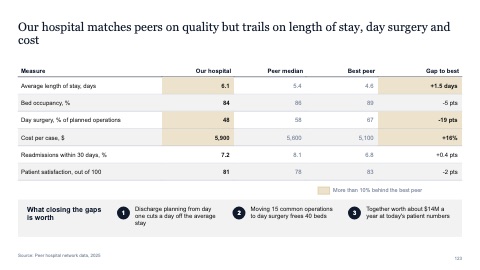
Benchmark table with highlighted gaps
MacWindows
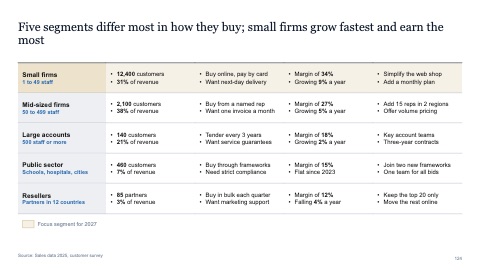
Five-column table without a header
MacWindows
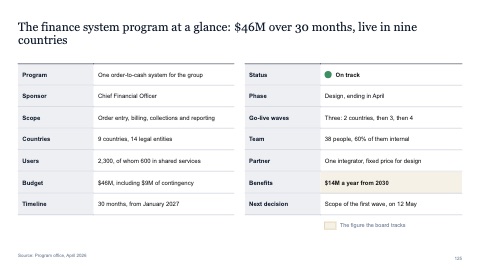
Fact sheet without a header
MacWindows
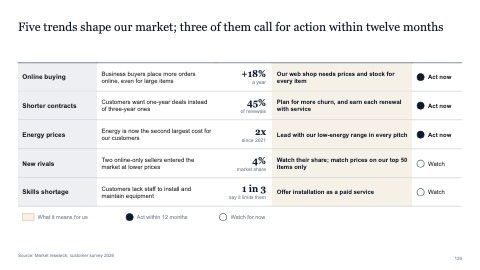
Table with an implication column
MacWindows
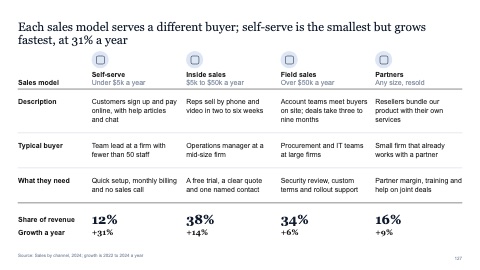
Conceptual table comparing four sales models
MacWindows
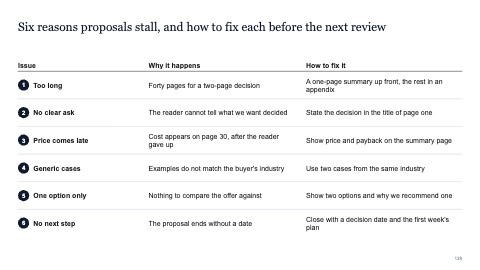
Issues, causes and fixes table
MacWindows
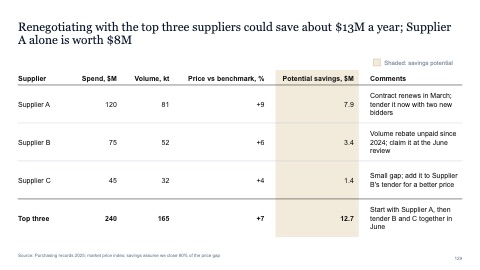
Supplier savings table with a shaded savings column
MacWindows
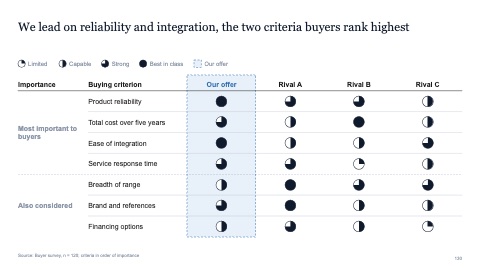
Buying criteria rated with Harvey balls against rivals
MacWindows
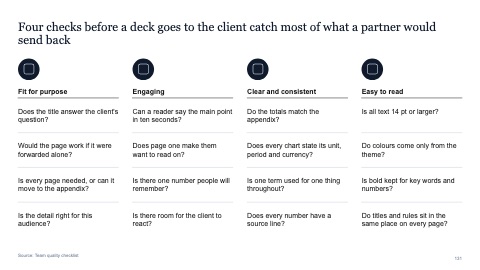
Checklist in four columns with icons
MacWindows
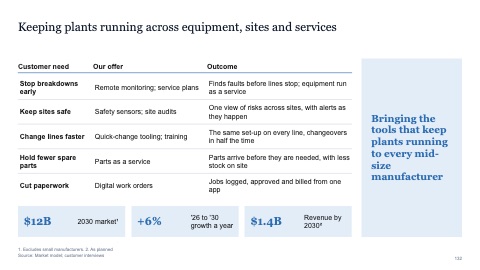
Needs, offers and outcomes with KPI tiles and a statement panel
MacWindows
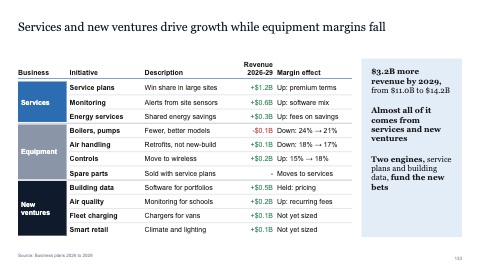
Initiatives grouped by business with revenue and margin effects
MacWindows
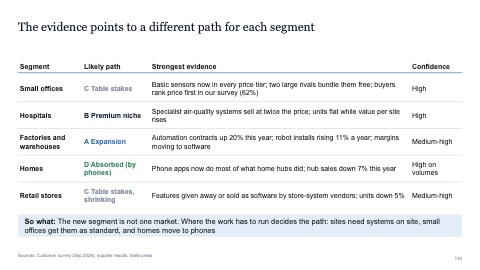
Evidence table: likely path, strongest evidence and confidence
MacWindows
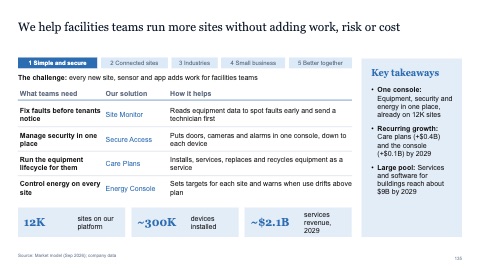
Needs and solutions with tabs, KPI tiles and key takeaways
MacWindows
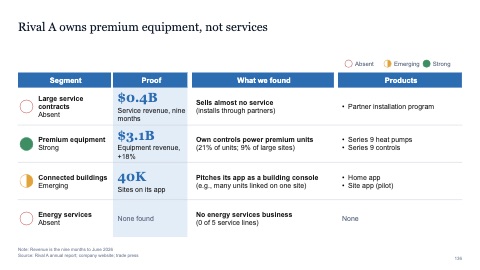
Rival profile by segment: standing, proof, findings and products
MacWindows
Numbers and names on the templates are samples. Replace them with your own.
Questions
What is a RACI matrix?
A table of tasks against people that marks who is Responsible, Accountable, Consulted or Informed for each task. It settles who does what before a project starts.
How do I make a table look clean in PowerPoint?
Keep lines light or remove them, align numbers to the right, use one highlight color for the row that matters, and put the takeaway in the title. The tables here start that way.
Try every page in your own deck
Every SlideShortcuts plan includes the templates, the keyboard shortcuts and the charts.
Start free trial7 days free, then $9.99 a month plus any tax. Card required. We email you 3 days before the trial ends. Cancel before day 7 and pay nothing.