World map slide templates for PowerPoint
Maps for global stories: world maps with continent labels or countries by region, value bubbles, map dashboards with numbered hubs or KPI tiles, and supply routes. Regions are ordinary shapes, so coloring the markets you're in, or the ones you're entering, is a click. Each one arrives in your deck's own colors and fonts.
- Mac: all 30, in the Templates tab of the SlideShortcuts panel.
- Windows: all 30, under Insert > Templates on the SlideShortcuts tab.
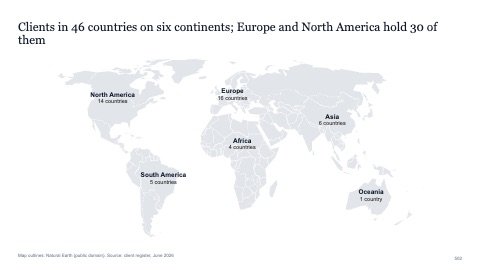
World map with continent labels
MacWindows
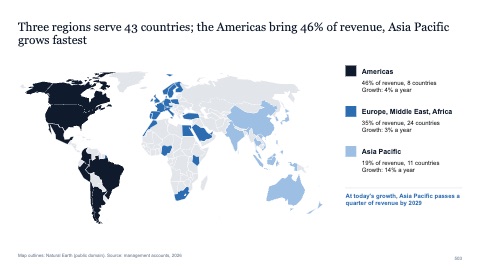
World map with countries by region
MacWindows
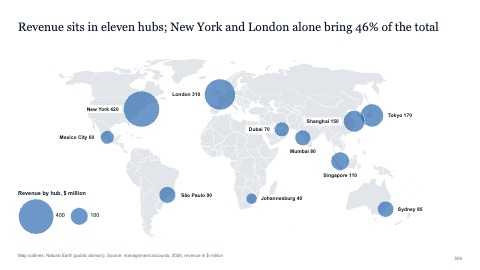
World map with value bubbles
MacWindows
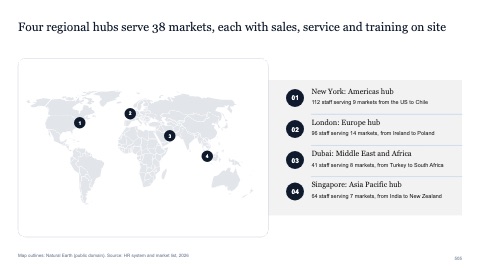
World map dashboard with numbered hubs
MacWindows
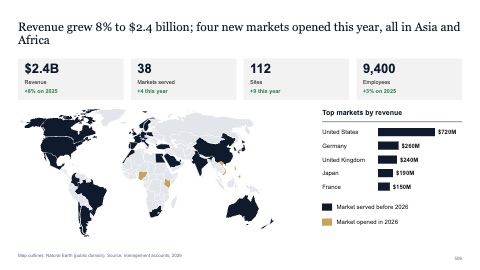
World map dashboard with KPI tiles
MacWindows
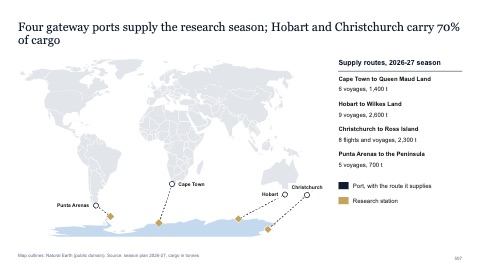
World map with Antarctica and supply routes
MacWindows
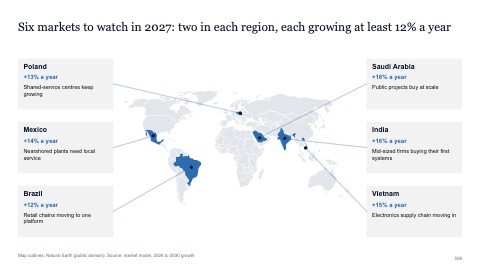
World map with six callouts
MacWindows
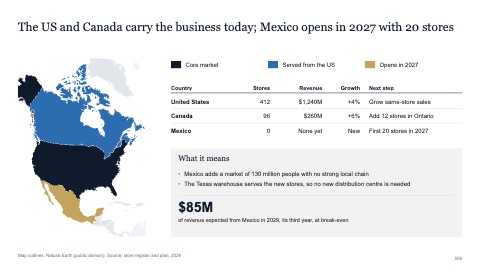
North America with three markets
MacWindows
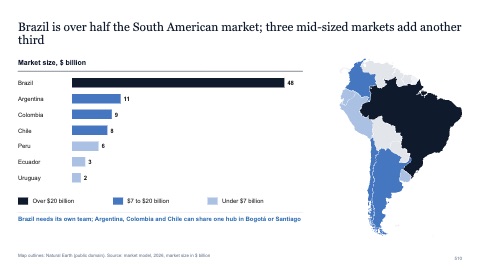
South America with a ranked bar chart
MacWindows
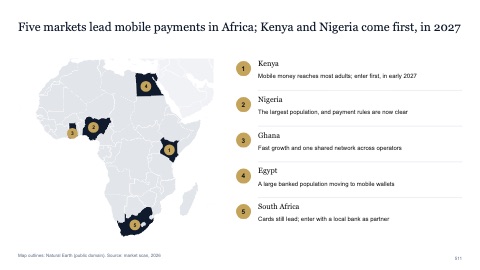
Africa with five numbered markets
MacWindows
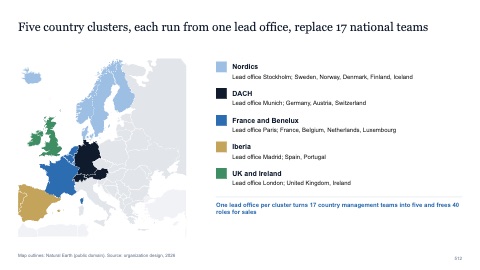
Europe with country clusters
MacWindows
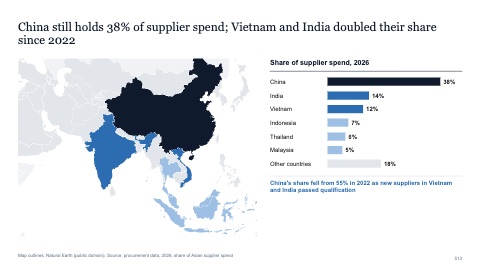
Asia with supplier countries
MacWindows
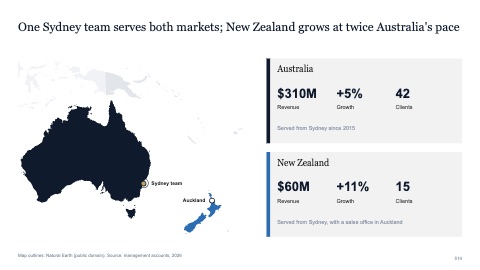
Oceania with two market cards
MacWindows
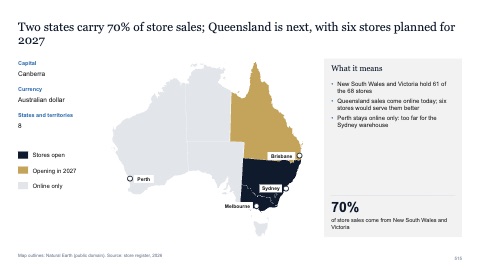
Australia with states highlighted
MacWindows
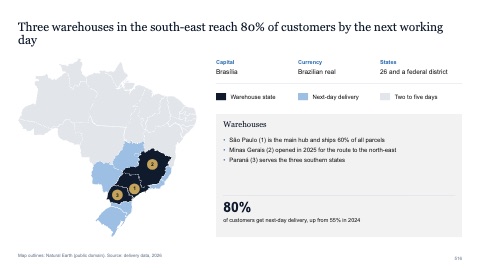
Brazil with warehouse states
MacWindows
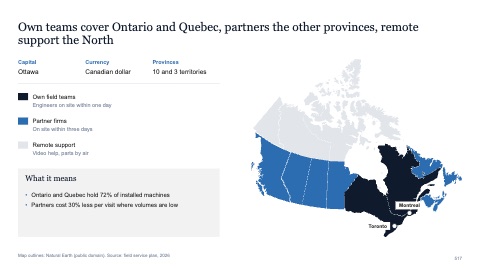
Canada with service coverage
MacWindows
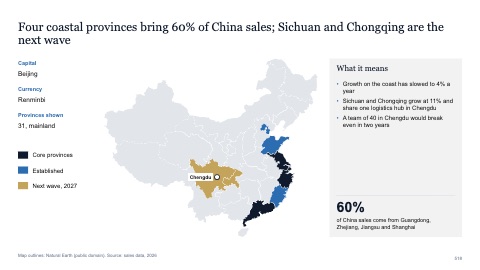
Mainland China with provinces highlighted
MacWindows
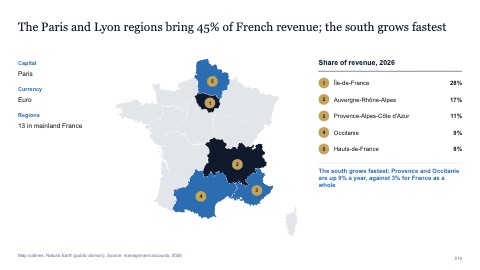
France with ranked regions
MacWindows
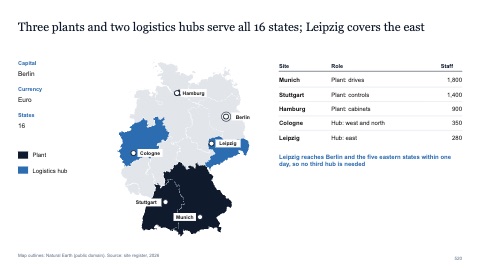
Germany with plants and hubs
MacWindows
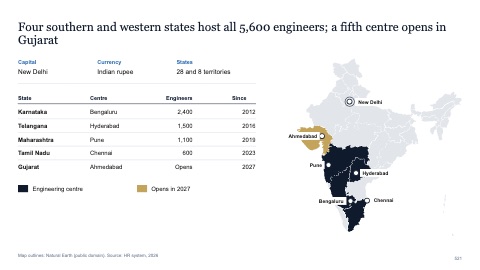
India with engineering centres
MacWindows
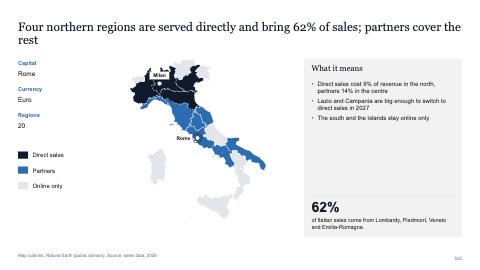
Italy with sales channels by region
MacWindows
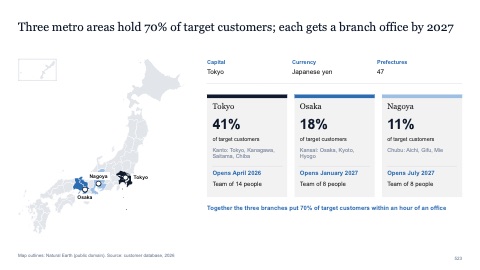
Japan with three metro areas
MacWindows
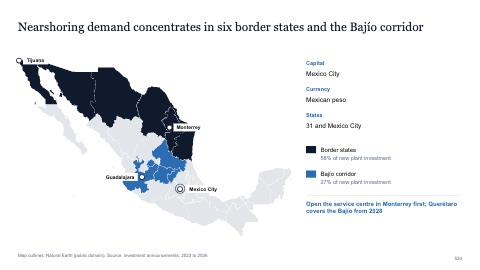
Mexico with manufacturing states
MacWindows
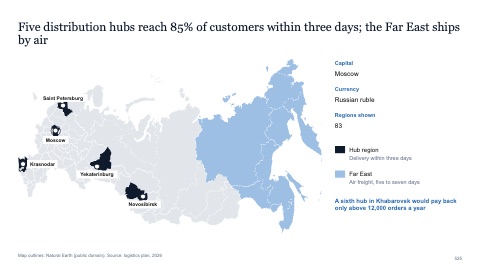
Russia with distribution hubs
MacWindows
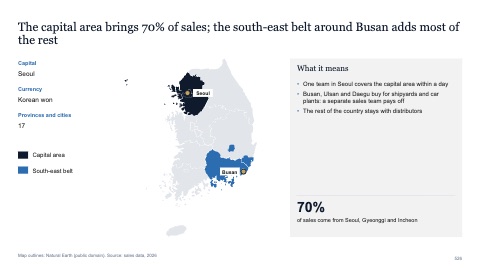
South Korea with two sales areas
MacWindows
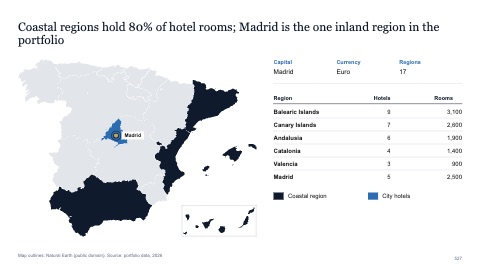
Spain with a hotel portfolio
MacWindows
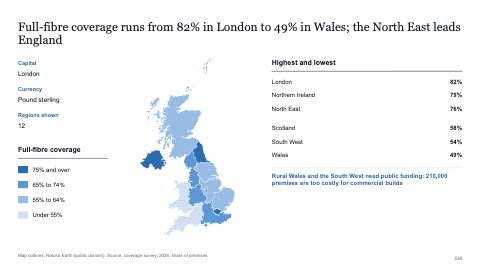
United Kingdom with a coverage heat map
MacWindows
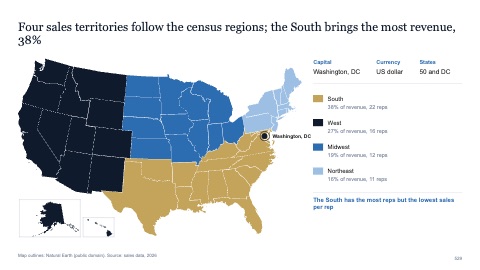
United States with sales territories
MacWindows
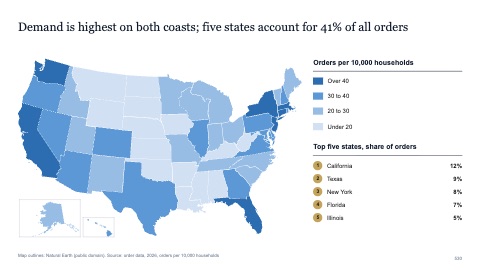
United States heat map with top five states
MacWindows
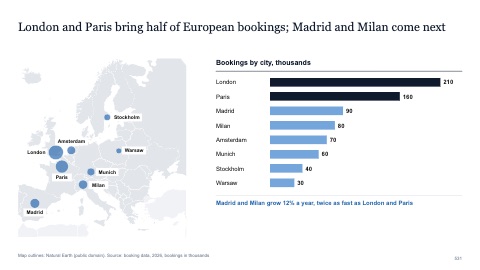
Europe with city bubbles and a ranking
MacWindows
Numbers and names on the templates are samples. Replace them with your own.
Questions
How do I color countries on a map in PowerPoint?
Use a map built from separate shapes, select the countries you need, and give them one fill. Use one color for the point and gray for the rest.
How do I show values on a world map?
Put a bubble on each location sized by its value, label the largest few, and add a short legend for the bubble size.
Try every page in your own deck
Every SlideShortcuts plan includes the templates, the keyboard shortcuts and the charts.
Start free trial7 days free, then $9.99 a month plus any tax. Card required. We email you 3 days before the trial ends. Cancel before day 7 and pay nothing.