Spider chart, sunburst and segmentation templates for PowerPoint
Pages for proportions and profiles: spiderwebs comparing two profiles or today against target, sunbursts of scores or revenue by unit and product, and segmentation cubes with three dimensions. Use a spiderweb when several scores together make a shape worth seeing. Each one arrives in your deck's own colors and fonts.
- Mac: all 14, in the Templates tab of the SlideShortcuts panel.
- Windows: all 14, under Insert > Templates on the SlideShortcuts tab.
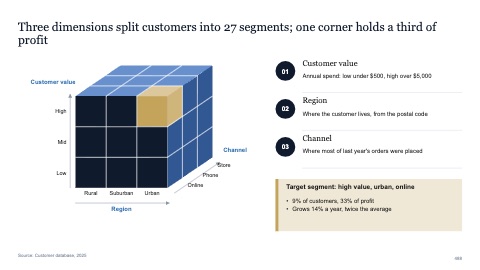
Segmentation cube with three dimensions
MacWindows
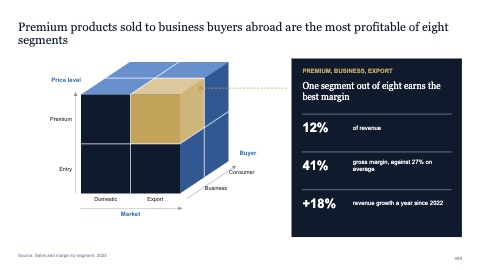
Cube with eight segments and a takeaway
MacWindows
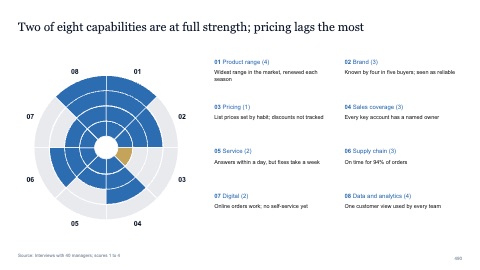
Sunburst of eight scores
MacWindows
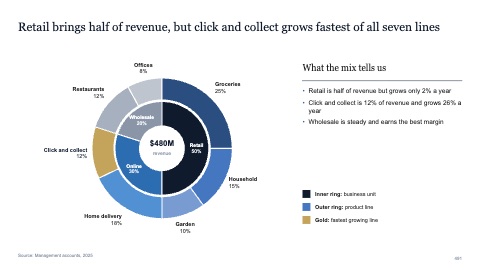
Sunburst of revenue by unit and product
MacWindows
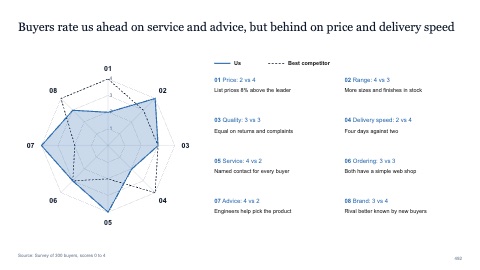
Spiderweb with two profiles
MacWindows
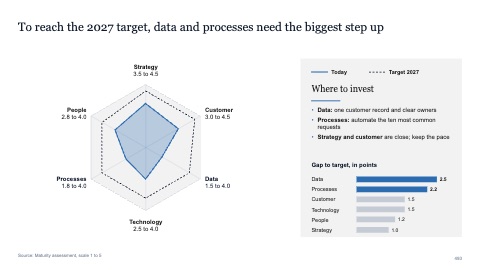
Spiderweb of today against target
MacWindows
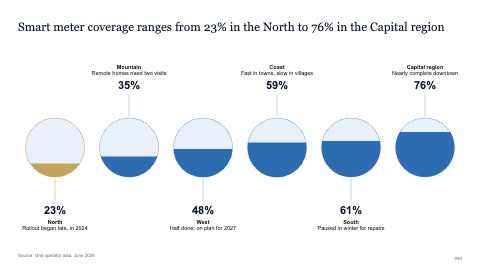
Six circles filled to their share
MacWindows
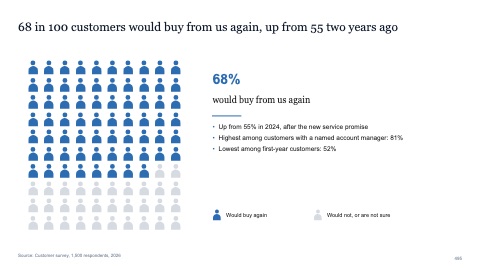
One hundred people with a share highlighted
MacWindows
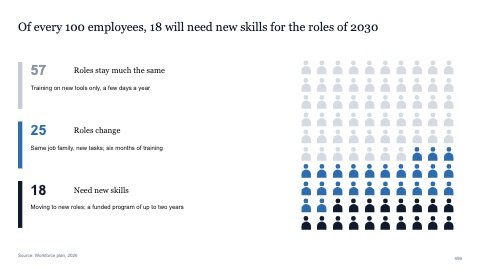
One hundred people in three groups
MacWindows
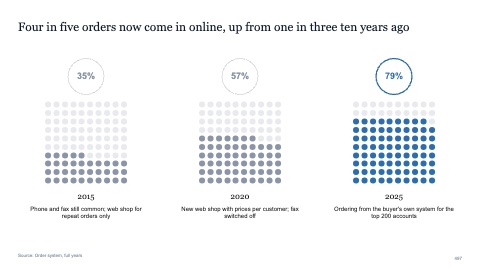
Three dot grids compared
MacWindows
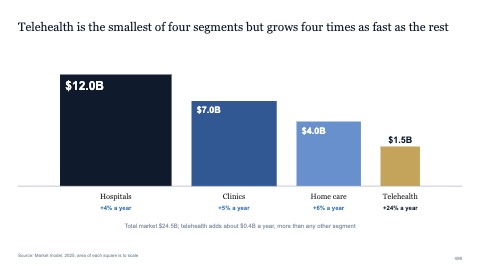
Scaled squares compared
MacWindows
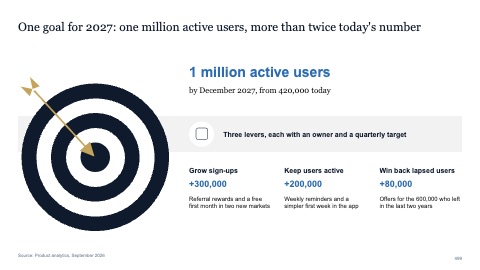
Goal with a target and three levers
MacWindows
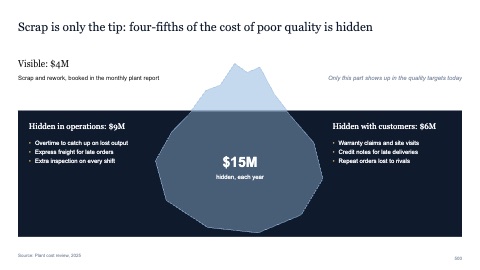
Iceberg of visible and hidden costs
MacWindows
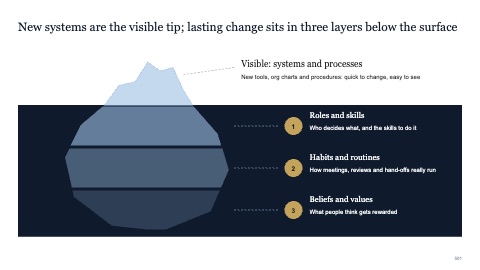
Iceberg with three hidden layers
MacWindows
Numbers and names on the templates are samples. Replace them with your own.
Questions
What is a spider chart?
Also called a radar chart: several scores on axes that start from one center, joined into a shape. Two shapes on the same axes show where one profile is stronger.
When should I use a sunburst?
When a total splits into parts and those parts split again, such as revenue by unit and then by product within each unit.
Try every page in your own deck
Every SlideShortcuts plan includes the templates, the keyboard shortcuts and the charts.
Start free trial7 days free, then $9.99 a month plus any tax. Card required. We email you 3 days before the trial ends. Cancel before day 7 and pay nothing.